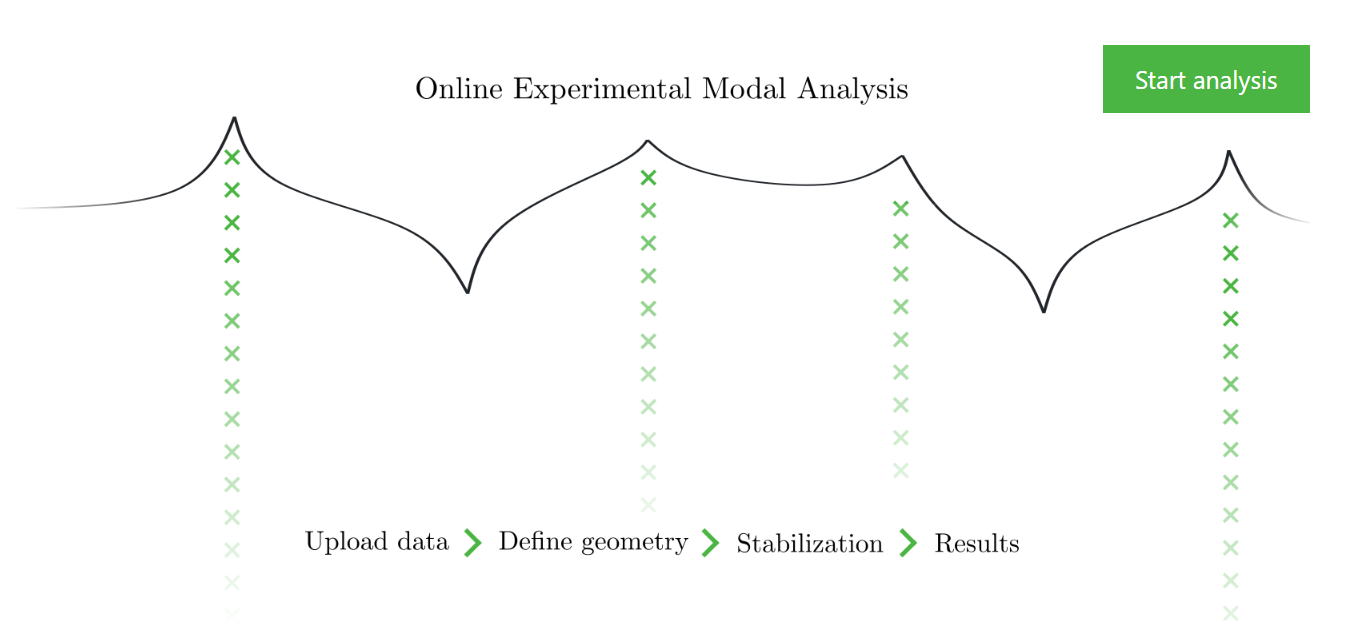
A quick guide on using Vibration Dashboard
Welcome to this short tutorial, highlighting the main features of Vibration Dashboard's EMA module.
Along with UFF, uploading CSV or MS Excel is currently supported. For each of the supported file formats, you can download an example file, to help you get started with the analysis.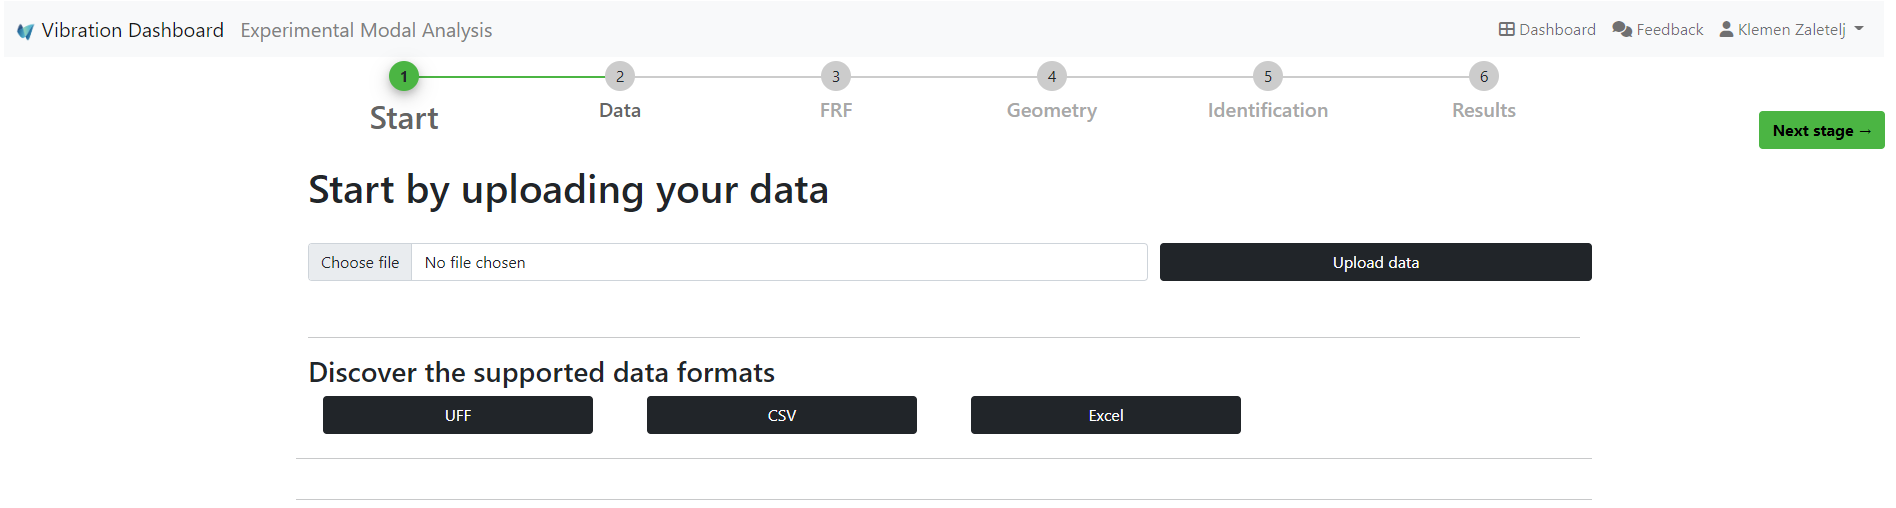
The Geometry view also support importing STL models as overlays of the measured geometry, to enhance the final visualization of the results.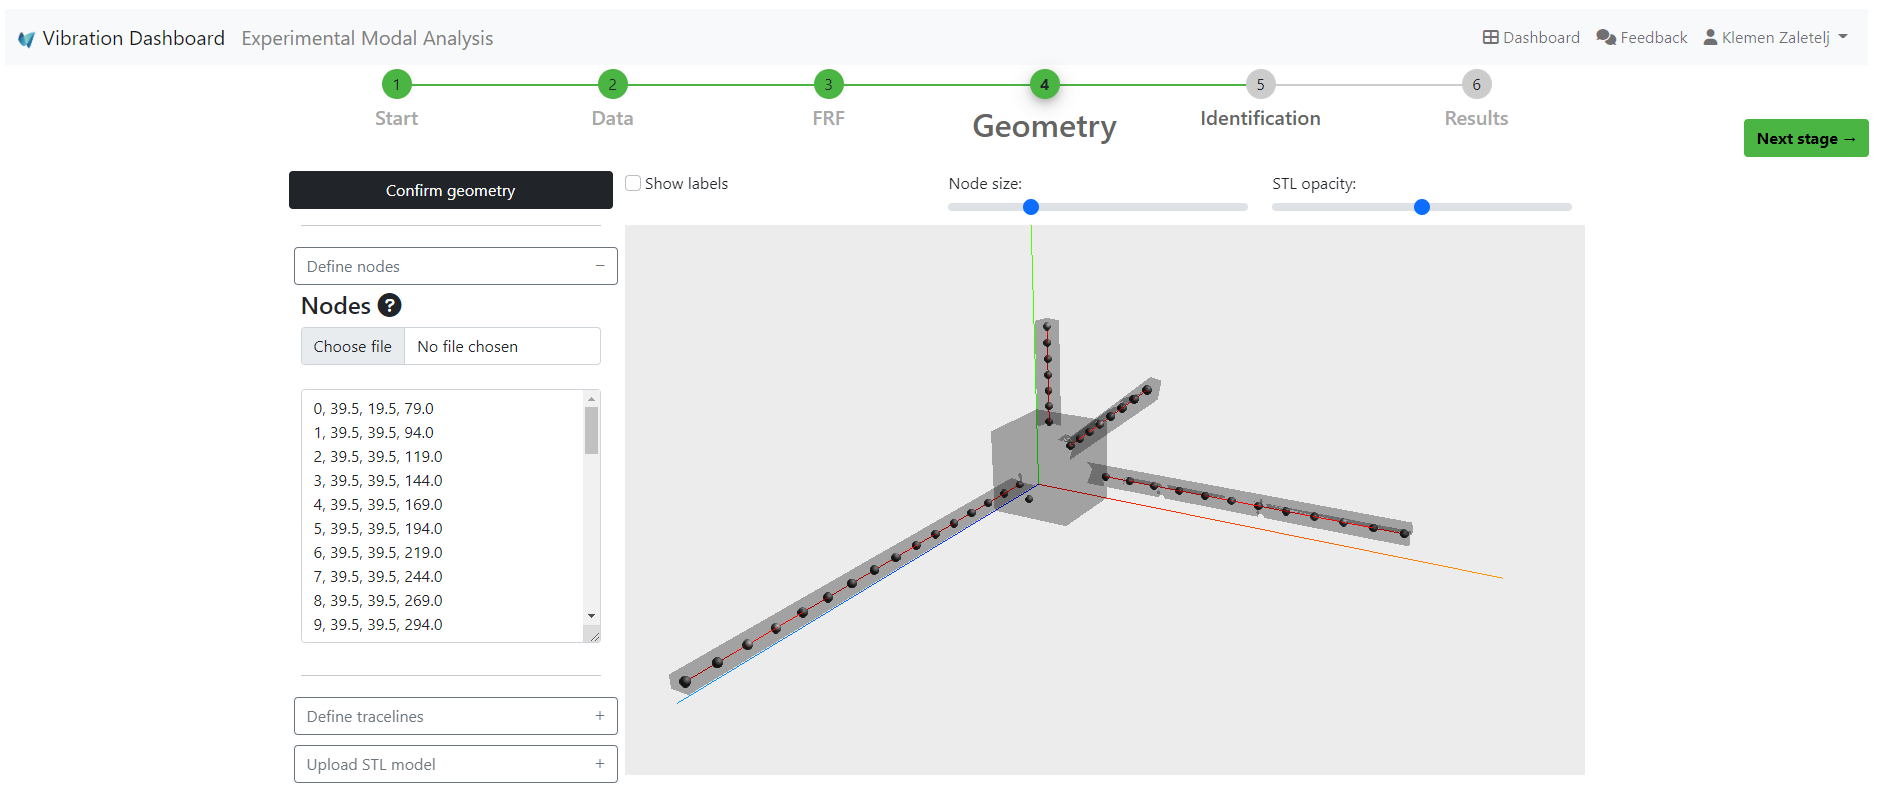
You can set up the analysis as well as perform pole stabilization in the Identification view.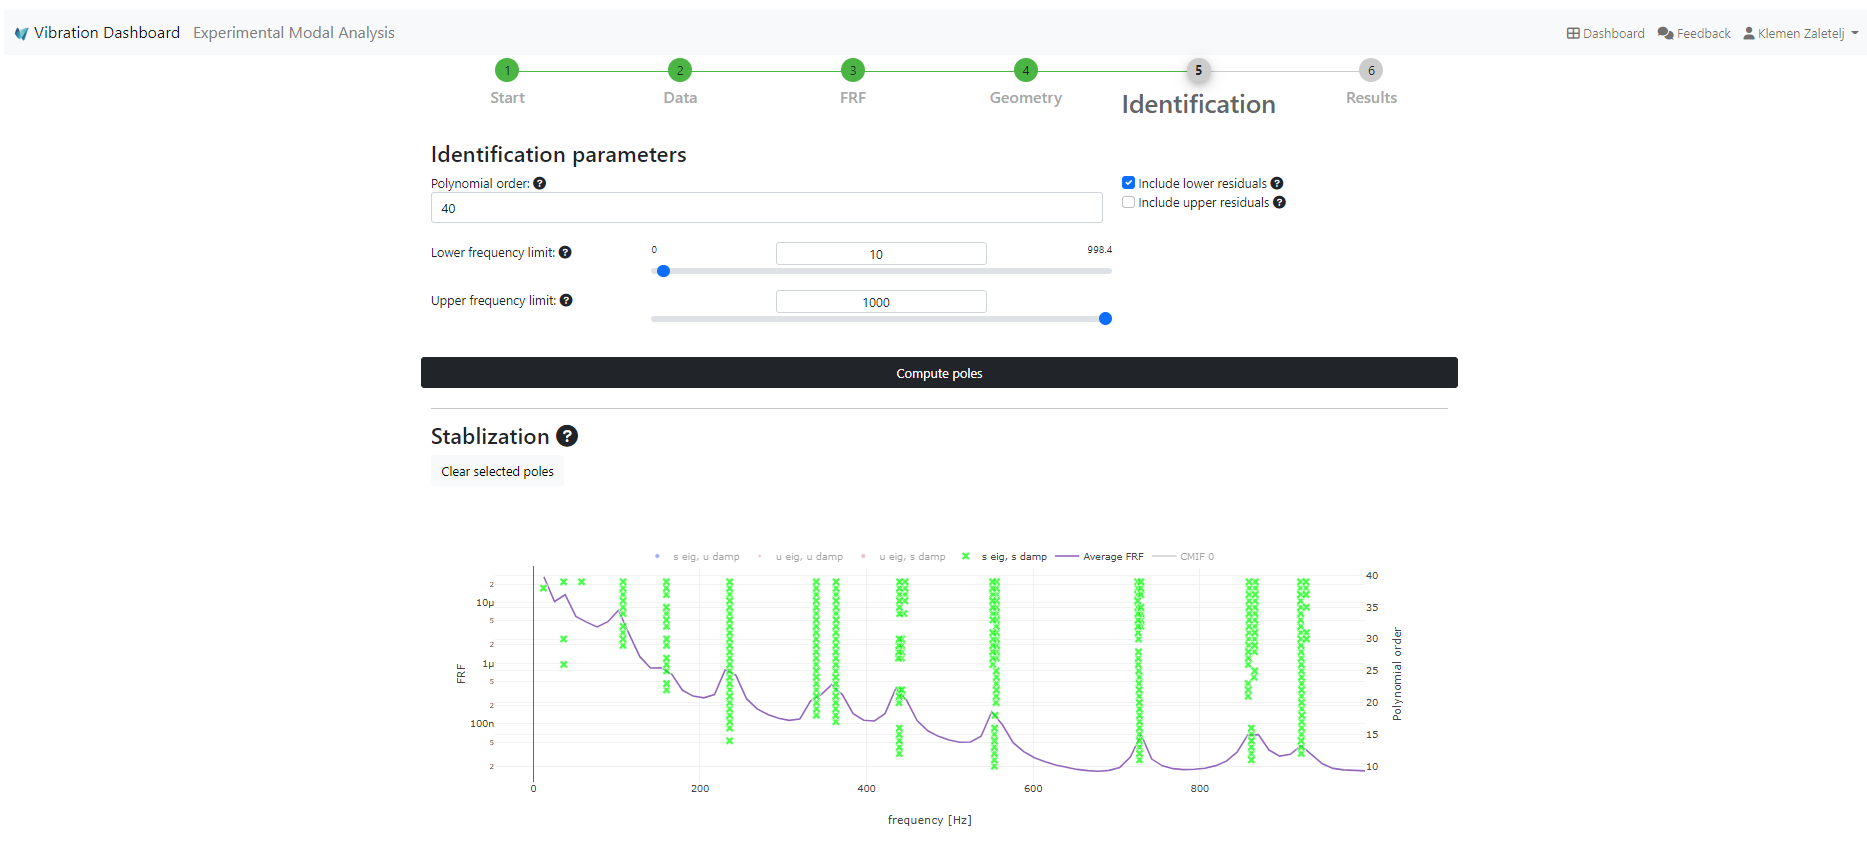
There are various options when exporting the analysis results, as well as an option of exporting the currently displayed mode-shape visualization image.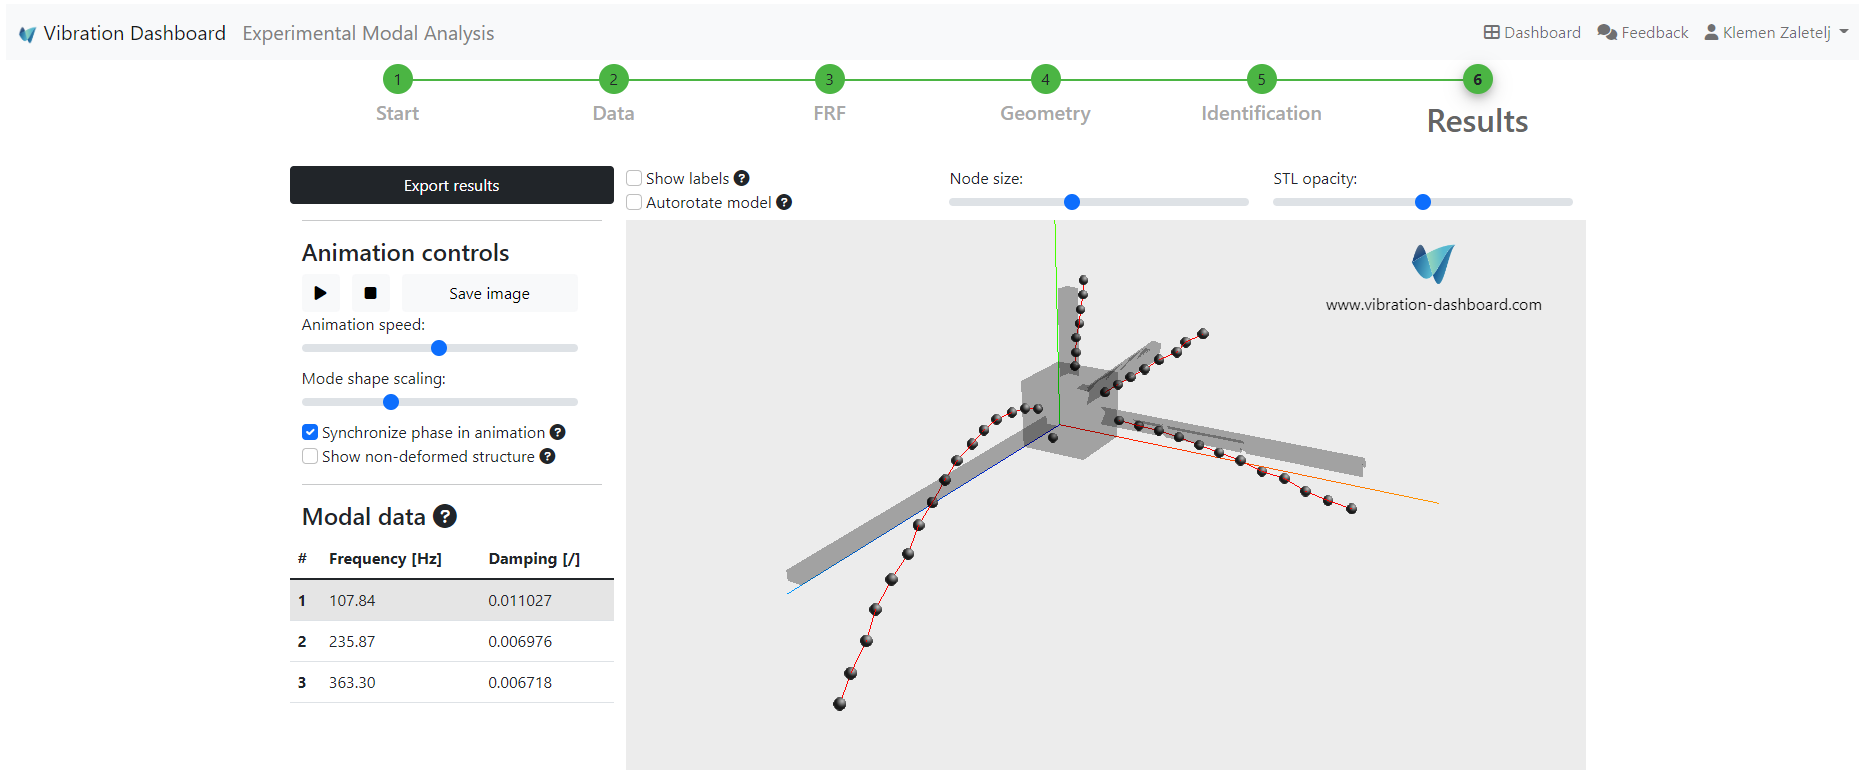
The Start view
The analysis starts by providing data. The basis of any modal identification are measured FRFs. Importing data about measurement nodes, for example via UFF, is also supported.Along with UFF, uploading CSV or MS Excel is currently supported. For each of the supported file formats, you can download an example file, to help you get started with the analysis.
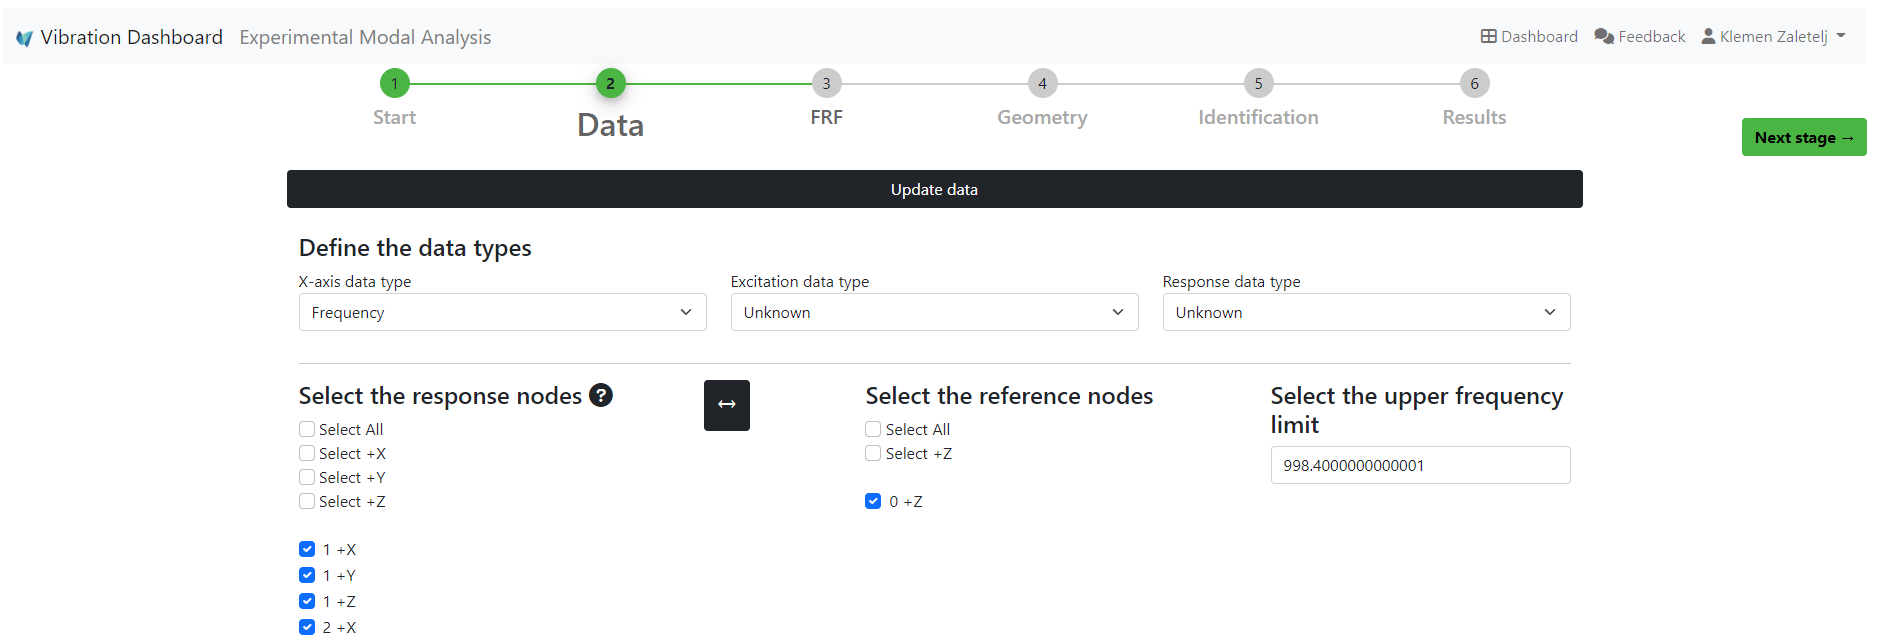
The Data view
The Data view is the next step of the analysis, where basic data preprocessing, such as defining the measurement channels and the analysis frequency range, is possible.
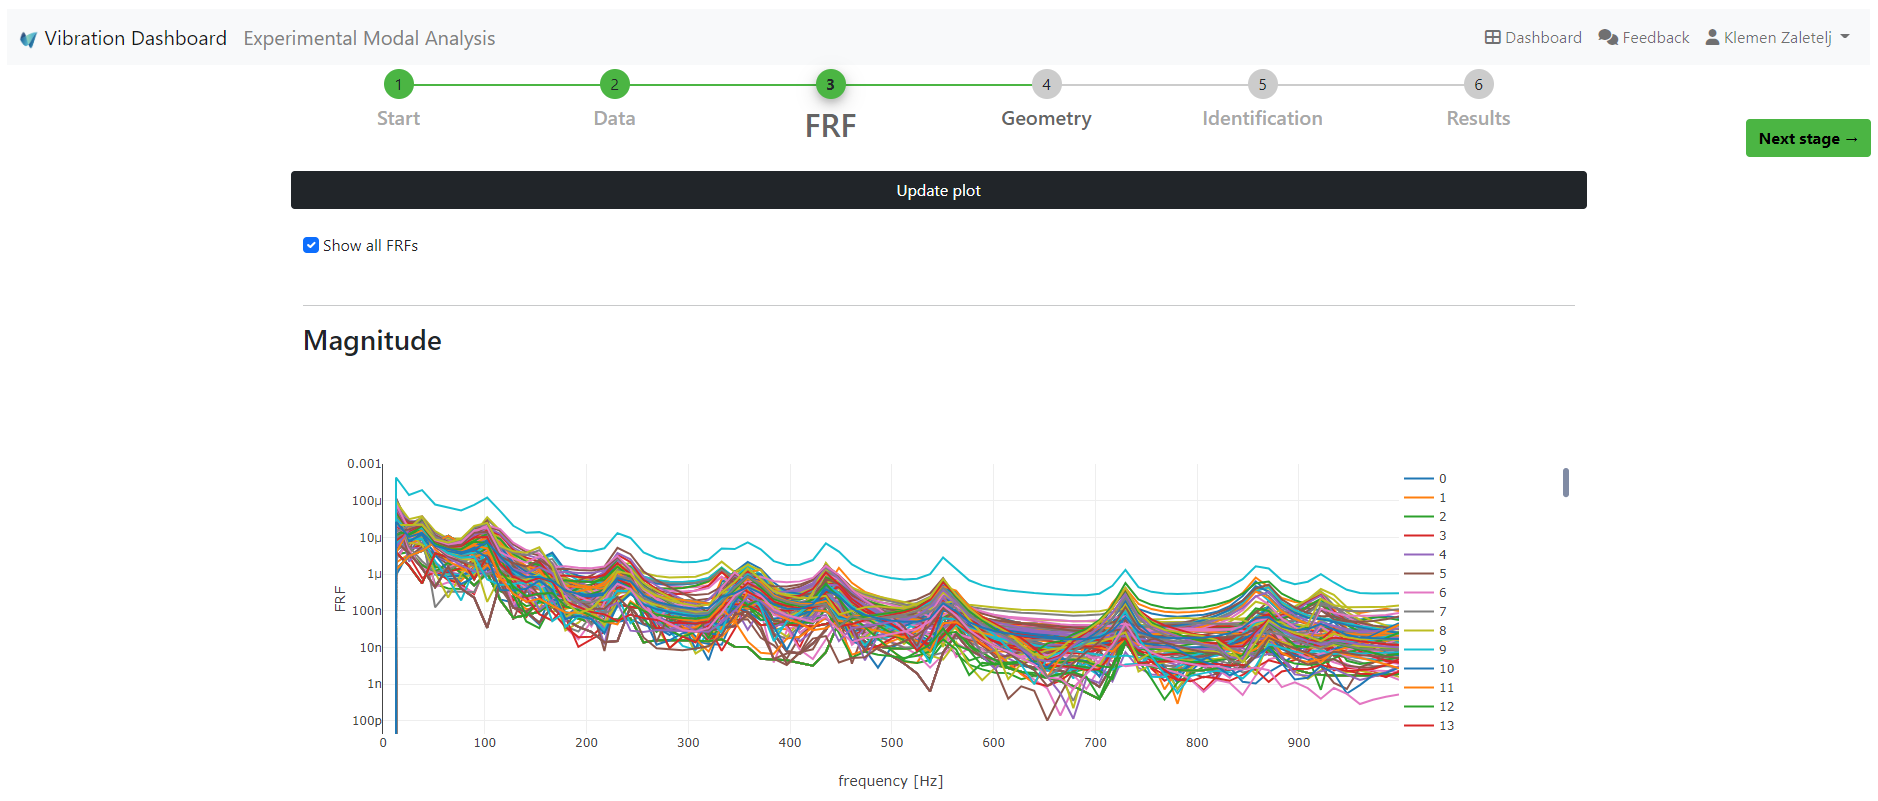
The FRF view
In the FRF view, the imported Frequency Response Functions can be checked prior to identification.
The Geometry view
If you wish to view an animation of the identified mode shapes you can provide information about the geometry of the measurement locations in the Geometry view. In this case, the node locations, orientations and connectivity were read from the uploaded UFF file.The Geometry view also support importing STL models as overlays of the measured geometry, to enhance the final visualization of the results.
The Identification view
Modal identification is the main step of the modal analysis process. The Least-Squares Complex Frequency domain method is currently supported.You can set up the analysis as well as perform pole stabilization in the Identification view.
The Results view
Now you can view the identification results in the Results view. In case the measurement geometry was set up in one of the previous analysis steps, this view shows a customizable animation of the identified mode shapes.There are various options when exporting the analysis results, as well as an option of exporting the currently displayed mode-shape visualization image.